From the overall diagram to the real message, without changing tools.
Three linked levels, documentation in every box and every arrow, and an AI that proposes without deciding.
Three levels, one process.
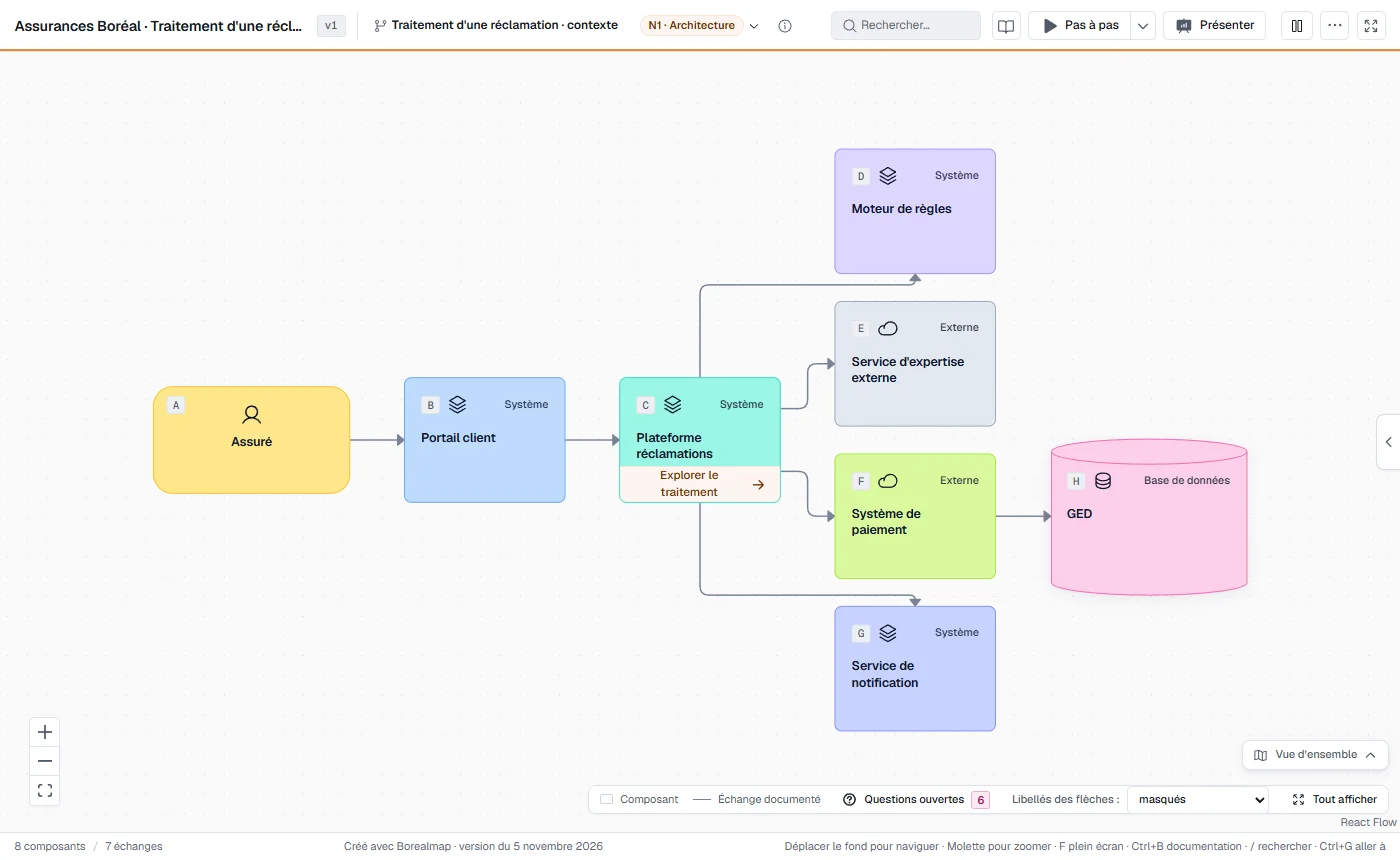
Architecture (N1), analysis (N2) and design (N3) describe the same process and live in the same diagram. You go down a level by entering a box, without opening another document.
- N1 Architecture: the major parts and their exchanges.
- N2 Analysis: the flow, the roles, the rules.
- N3 Design: the technical detail and the messages.
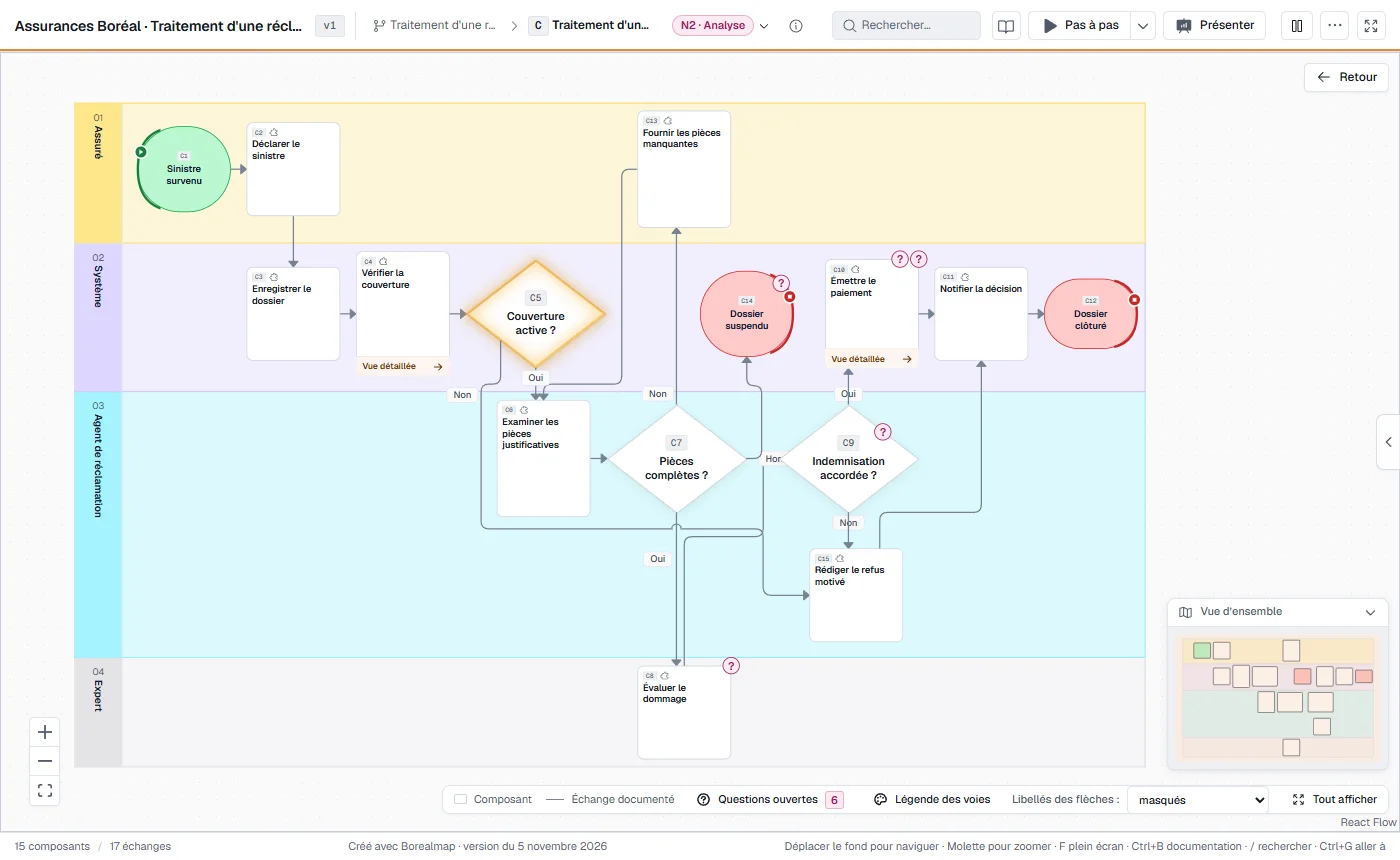
Analysis, with its lanes and its decisions.
Each step has its owner, its rules and its error cases. Decisions show both branches, so that a refusal is as readable as the nominal case.
- Lanes by role or by team.
- Open questions visible on the diagram.
- Statuses on boxes and arrows.
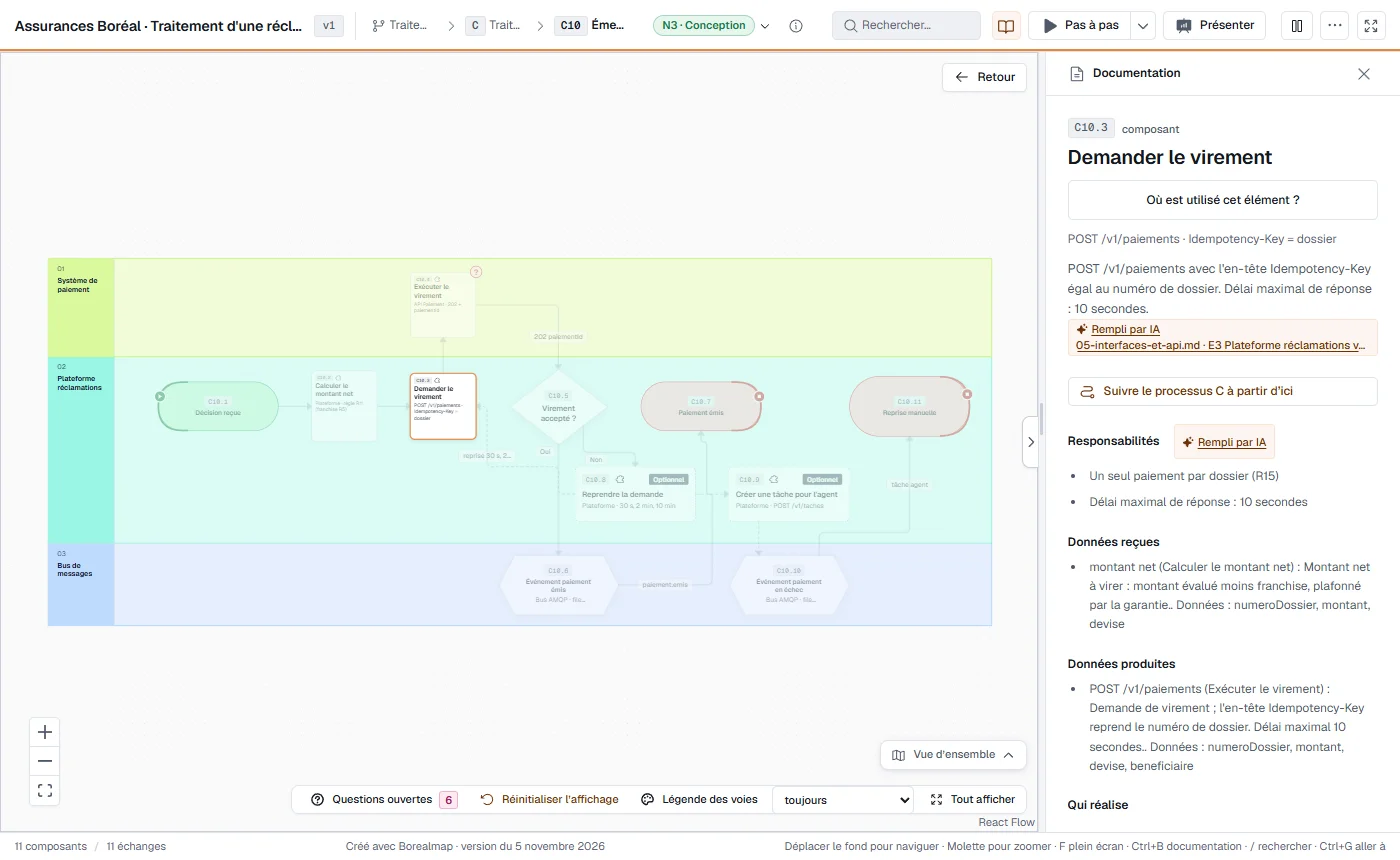
Documentation, in the right place.
In every box and every arrow: owner, rules, errors, protocol, real message example. A newcomer or the neighbouring team understands an exchange without searching through three documents.
- As many business rules as needed, each with its number and source.
- Real message example in an arrow’s sheet.
- Link to the other places where the item is used.
- Fields filled in by an AI are marked and cite their source.
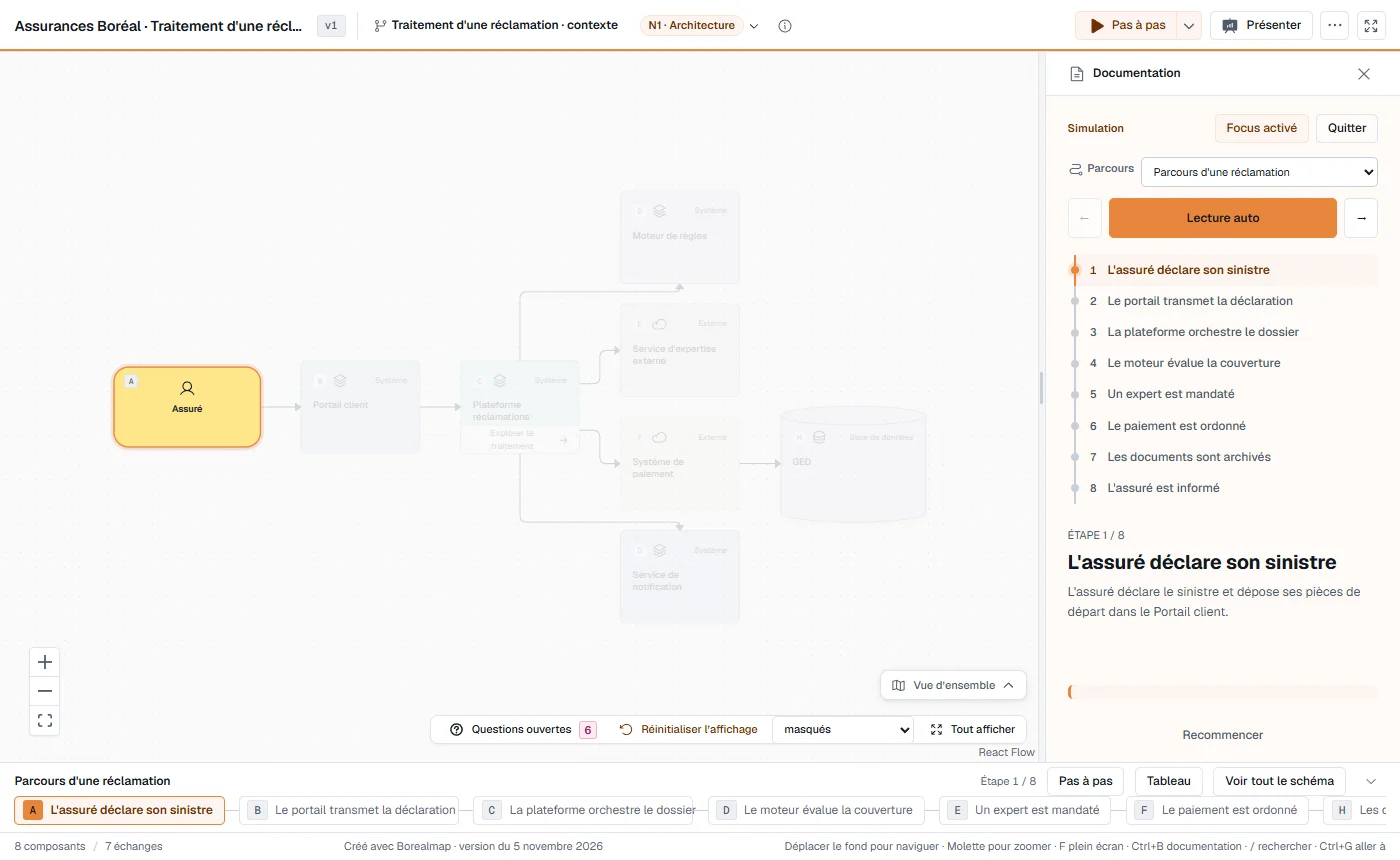
The sequence first.
A process is understood in order. “Step by step” highlights the current step and dims the rest, with automatic or manual playback. Each diagram can have several paths: nominal case, refusal, exception.
- Auto play, previous, next.
- Several paths per diagram.
- Presentation mode with highlighting and presenter view.
From the business need to the step that meets it.
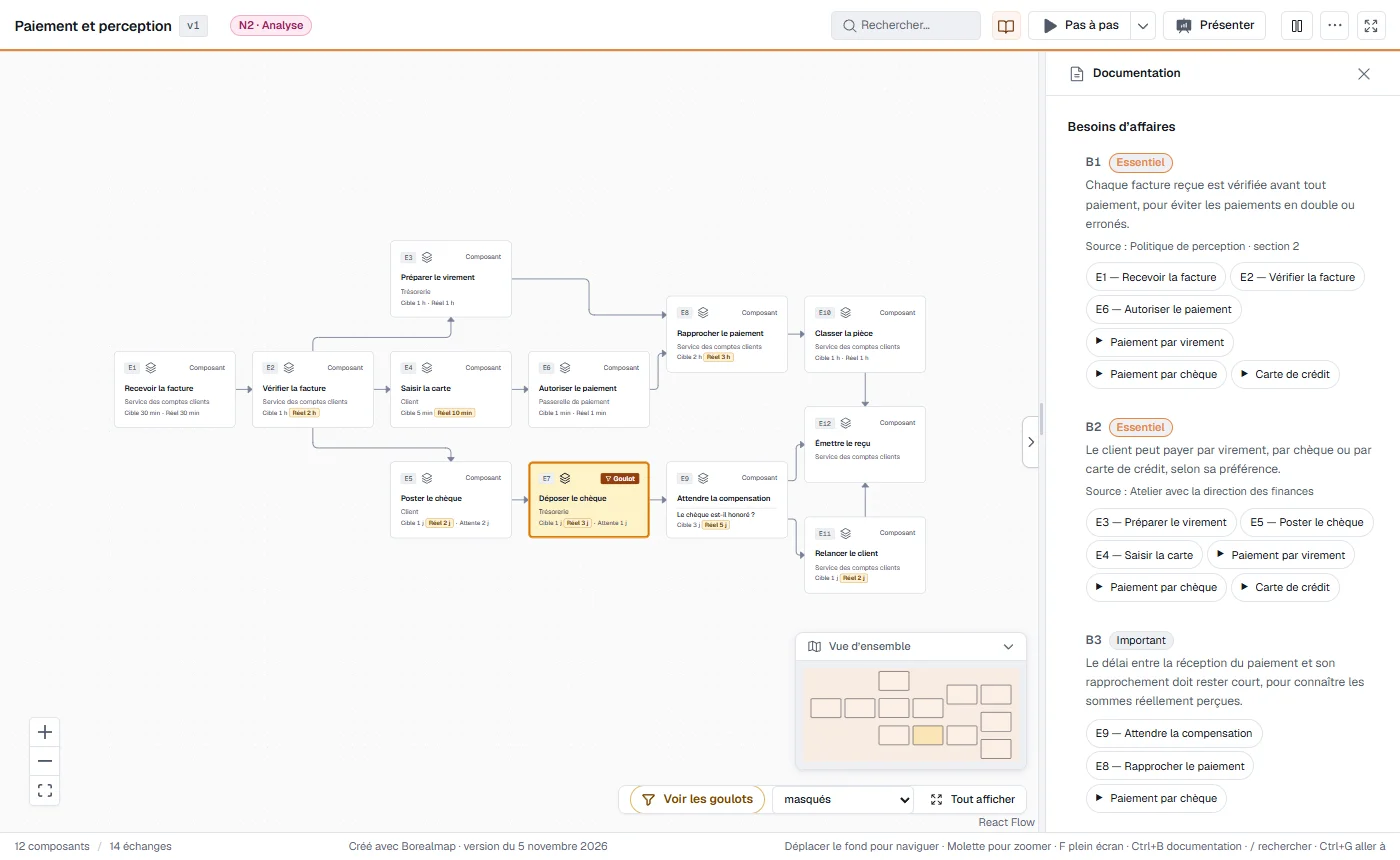
Each diagram carries its business needs: why the process exists and what it must achieve. Each need is linked to the boxes and paths that meet it, and each box keeps its own business rules. You know why a step exists, and what you affect when you change it.
- Diagram needs: code, statement, priority and source.
- Each need linked to the boxes and paths that meet it.
- Business rules in each box, numbered, with their source.
- CSV export of the needs for review with the business.
Lead times, where they happen.
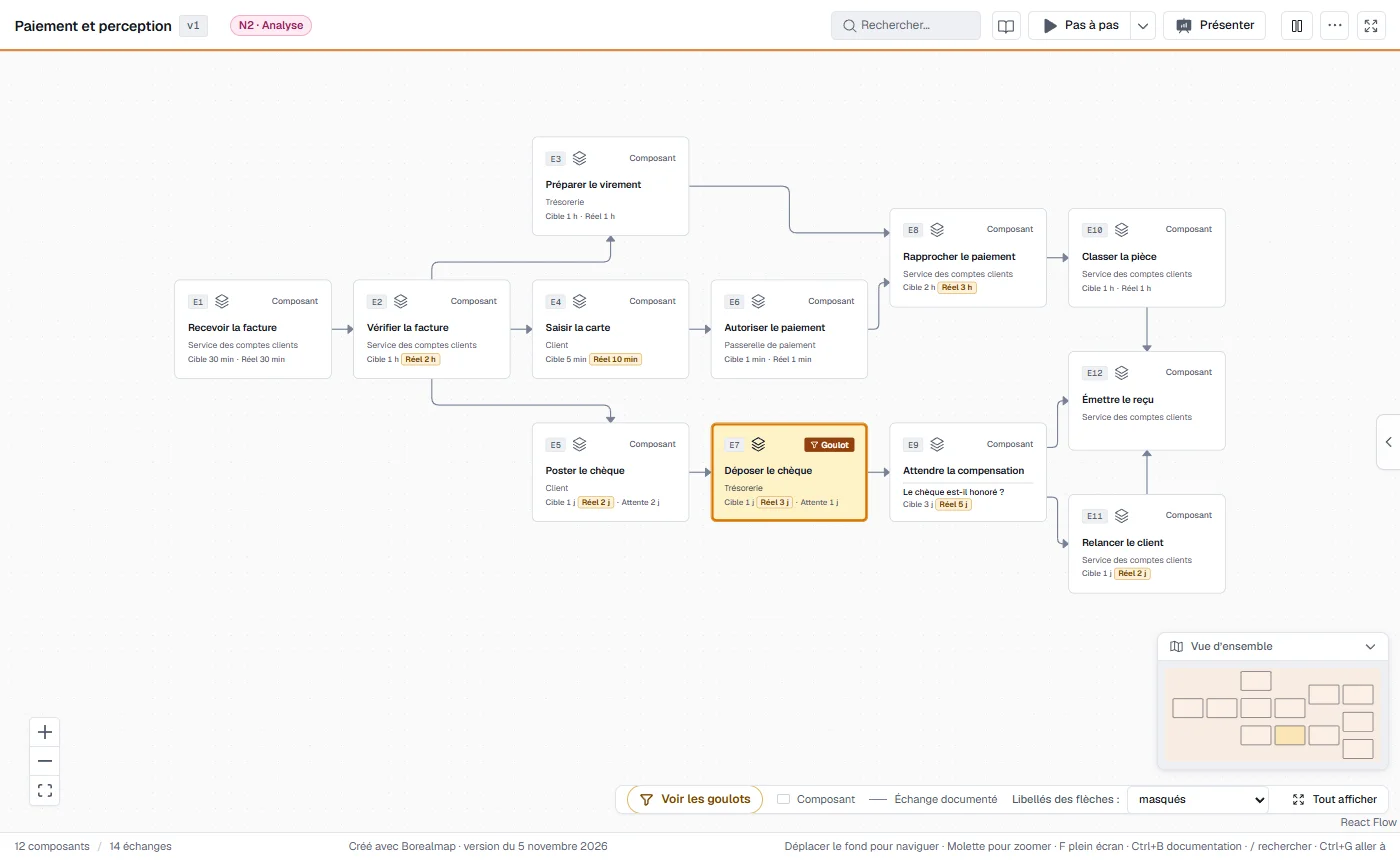
Each step can carry its target time, its actual time and its waiting time, in minutes, hours, days or weeks. Borealmap adds up the times of a path, flags overruns and marks bottlenecks. You then compare two to four paths side by side to see which one takes the longest.
- Target time, actual time and waiting time per step; adjustable working day (7.5 h by default).
- Totals and overruns in Step-by-step mode.
- “Bottleneck” status and a filter to see every bottleneck at once.
- Comparison of 2 to 4 paths: shared steps, differences and total times, with CSV export.
One documentation, read from top to bottom.
Each item’s sheet starts with the essentials, continues with the business side and ends with the technical detail. Management stops at the top, analysts read the middle, technical teams go to the end: everyone looks at the same diagram, with no setting to choose and no separate copies.
An AI with review and cited sources.
Borealmap provides no AI. You plug in your organization’s own through open interfaces (MCP server and skills), in a working folder that you choose.
Reading
The AI reads the diagram exported for it and your documentation.
Proposal
It proposes text for empty fields, with a cited source for each suggestion.
Decision
You accept, edit or reject each suggestion. The structure, identifiers, colours and positions are never modified by an AI on an existing diagram.
A new diagram drawn by an AI is a draft marked “AI draft”, which a person validates before it becomes an organization diagram.
To take over an existing diagram, you import a Visio (.vsdx), BPMN, draw.io, Mermaid or PlantUML file (read directly, no AI) or an image (reproduced by your AI); you compare it with the original using transparency, correct it, then validate. For an image, quality depends on the connected AI and on how legible it is: plan for human review.
Where we stand, in all frankness.
Available means it can be demonstrated today. In pilot: built and tested locally, offered to pilot customers once the hosted environment is deployed and validated with their organization. Planned: decided, not yet in place.
- Three linked levels
- Documentation of boxes and arrows
- Step-by-step mode
- Presentation mode
- Statuses
- Business needs and rules
- Target and actual times, bottlenecks
- Path comparison
- Visio, BPMN, draw.io, Mermaid, PlantUML and image import
- BPMN export
- Export for AI
- Company official diagrams
- Agile modes: review, backlog, story map, retro, RACI, risks, stakeholders, project status, meeting notes, roadmap
- Jira / Azure DevOps import and export (CSV)
- Microsoft Entra ID or email-code sign-in
- Live collaboration
- Administration console
- Quebec Law 25 (Loi 25) export and deletion
- Audit log
- AWS hosting in Montréal
- Independent penetration test
- Insurance
- Legal review of contracts
Explore example diagrams.
Fictional but complete examples, opened in the Borealmap viewer. Go down a level, play the sequence, open a step’s documentation.